Zoning, R-codes, structure plans & DBCA reserves — seven new planning layers for every Perth suburb
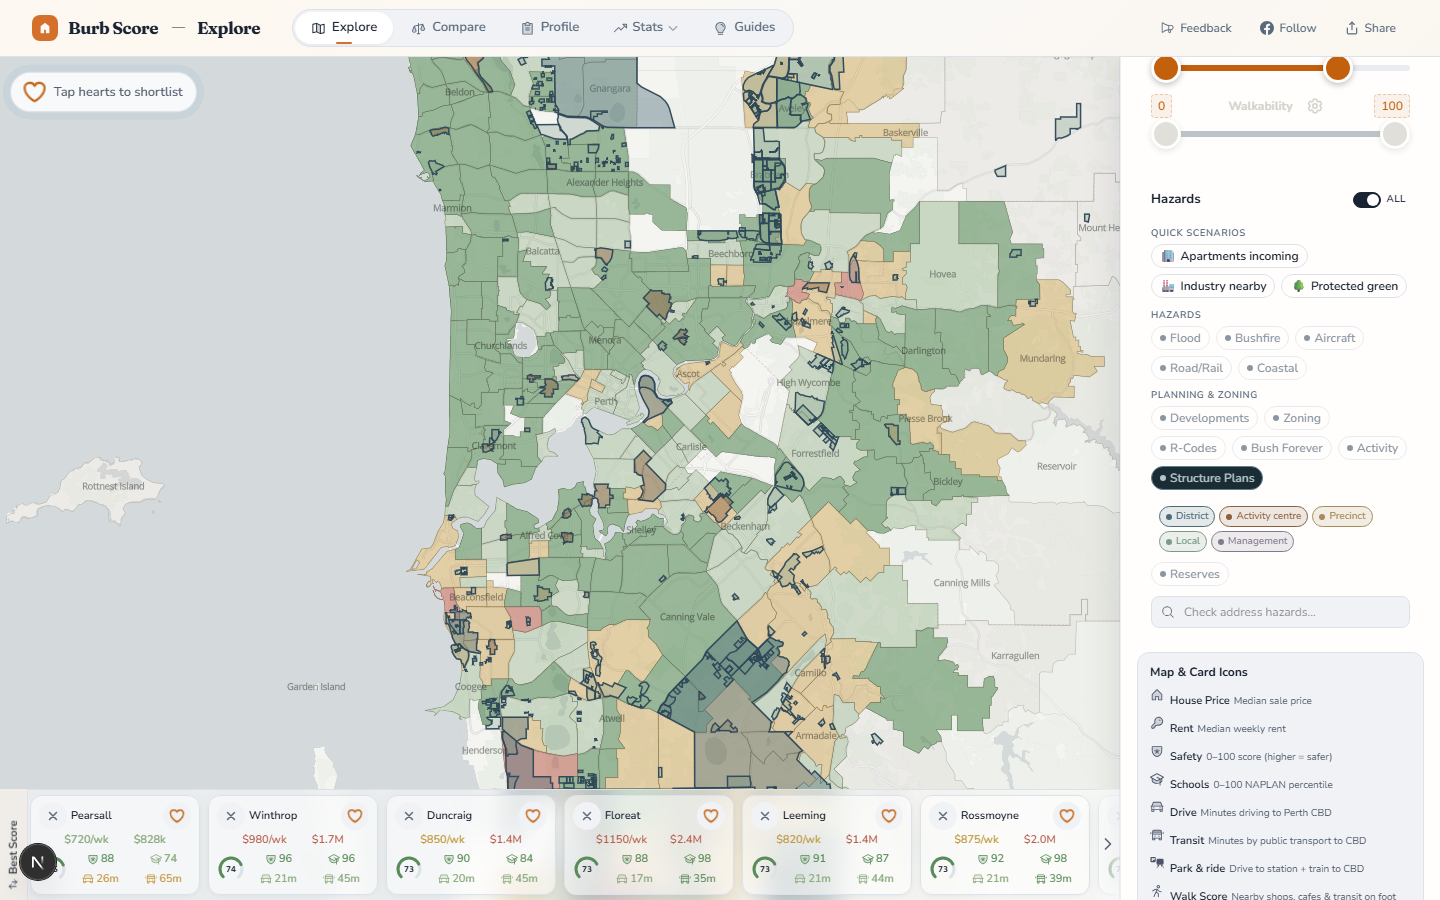
Today we shipped seven new planning overlays on the Explore map and every suburb profile. Together they give you something no other Perth property tool does at a suburb level: the complete planning picture — what can be built, what's already approved, what's permanently protected, and what's about to change.
This is the information Perth buyers, renters and investors have always been told to go and dig up themselves across half a dozen government websites. Now it sits on one interactive map, tappable, comparable, and refreshed quarterly.
Why this matters
Perth is in the middle of the sharpest housing reshuffle in a generation. Density codes are lifting across the inner-and-middle ring, the Urban Development Program has 630+ active residential projects in the pipeline, the Bush Forever scheme has locked away 51,000 hectares of urban bushland, and the state government is simultaneously endorsing hundreds of Structure Plans that carve out the next 10 years of growth.
A decade ago you could buy a quiet R20 single-house suburb and be confident about what you were getting. Today that same suburb might be split-coded R20/R40 or sitting inside an activity centre Structure Plan with thousands of planned apartments. Knowing which is the difference between a sound purchase and a shock three years down the line.
The seven new layers
🏘️ Zoning — 46,461 polygons
Every Local Planning Scheme zone across the Perth metro area, sourced live from the Department of Planning, Lands & Heritage MapServer. The overlay covers every zoning category that exists under WA's Planning and Development Act — residential, commercial, industrial, mixed use, centre, parks & recreation, rural, civic, infrastructure and special control areas.
Tap any polygon and the tooltip shows the exact scheme label (e.g. "R40 Residential"), the LGA and scheme number (e.g. "City of Stirling — LPS 3"), any special area overlay like heritage or character protection, any additional-use label, and the plain-English interpretation: what can actually be built there. For a commercial zone, for example, the tooltip will tell you "Shops, offices, retail — no residential (or limited upper-storey)". No more squinting at scheme text.
🏠 R-Codes — 22,872 polygons (SPP 7.3 Volume 2)
WA's residential density codes, from R2 (rural-residential 4,000m² lots) right through to R200 (high-density urban apartments). Split codes like R20/R40 are parsed so the tooltip tells you both the current entitlement and the upgraded entitlement on rezoning — including the minimum lot size, the average lot size, the number of dwellings permitted per hectare, and the types of dwelling that are permitted at that density.
This is the single most valuable piece of pre-purchase intelligence on the map. An R25 codes you to 25 dwellings per hectare (single house or duplex on 300m²+). An R80 codes you to 80 dwellings per hectare (apartments, typically 3–4 storey). A split R20/R60 tells you today it's a single-house street but it is coded to become a medium-density apartment precinct. Tap and know.
🏗️ Structure Plans — 841 endorsed plans
The master plans that carve out Perth's future growth. Each polygon is a structure plan endorsed by the Western Australian Planning Commission, complete with its planned dwelling yield, population yield, lot yield, site area in hectares, endorsement date, and expiry date. Tap an Ellenbrook or Alkimos polygon and the tooltip will show "12,500 dwellings · 32,000 residents · Endorsed 2019 · expires 2034".
For buyers this is a revelation. You now know, before you sign, not just what a suburb looks like today but what it is legally planned to become over the next ten years. For investors this is a leading indicator of rental and capital growth.
🎯 Activity Centres — 98 nodes (SPP 4.2)
The designated growth nodes under the State Planning Policy 4.2 hierarchy. Capital City (Perth CBD), Strategic (Joondalup, Rockingham, Fremantle, Midland, Armadale etc.), Specialised (major hospitals, universities, airports), Secondary (subregional centres), and District (local centres with shops and services). Each tier gets a distinct colour on the map so the hierarchy is visible at a glance.
🌳 Bush Forever — 356 permanent protection areas (SPP 2.8)
The 51,000+ hectares of urban bushland that State Planning Policy 2.8 has locked away permanently. Unlike a council park, Bush Forever areas cannot be rezoned or sold — they are protected by state legislation for biodiversity and amenity. If you live next to one, that bushland stays bushland for the rest of your life.
🏞️ DBCA Reserves — 1,542 state-managed reserves
Every reserve managed by the Department of Biodiversity, Conservation and Attractions — national parks, nature reserves, conservation parks, state forests, regional parks, marine parks, crown reserves, and Section 8A managed land. Tooltips expose the Class (A/B/C under the Land Administration Act), the vesting body, the reserve's legislating Act, and the polygon area in hectares. Class A reserves have the highest level of statutory protection and require Parliament to degazette.
🚧 Developments — the UDP pipeline
The Urban Development Program pipeline of approved and planned residential developments, staged 0–5 years, 6–10 years, and 10+ years. Tooltips show the estate name, LGA, developer reference, total lot yield across the three horizons, and commercial floor counts where applicable.
Three scenario presets — ask a question, get an answer
Layer toggles are powerful but require you to already know what you're looking for. Presets flip that around: pick the question and we'll turn on the right combination of layers and sub-filters in one click.
- 🏢 Apartments incoming — high-density R-codes (R80+), strategic and capital activity centres, and residential developments in the 0–5 year pipeline. Turn this on when you're trying to avoid a quiet-street-becoming-an-apartment-strip.
- 🏭 Industry nearby — industrial-category zoning and freight / rail noise corridors (SPP 5.4). For anyone who's been burned by buying a house and then learning the lot behind it is an industrial transport corridor.
- 🌳 Protected green — Bush Forever plus parks-category zoning. For buyers prioritising permanent green space over council-maintained ovals that might be rezoned.
Per-layer sub-filter chips
Categorical layers have a lot going on. Perth's Zoning layer alone has 11 category types; R-Codes spans 18 density bands; the DBCA Reserve layer has 9 protection categories. Turning on a layer shouldn't mean drinking from a firehose.
When you toggle a rich-category layer on, a row of sub-filter chips appears underneath it. Each chip is the same colour as its category on the map, so you can instantly trace "which chip matches that polygon". Tap a chip to show only that category. You can isolate industrial zoning across Perth in two taps, or R80+ high-density codes only, or national parks and nature reserves excluding state forests.
An active-count badge on the parent layer pill ("3/11") tells you at a glance how many sub-categories are on.
Data sources and credibility
Every polygon on every layer is sourced live from official WA government open data:
- Zoning, R-Codes, Structure Plans, Activity Centres, Bush Forever — DPLH Property and Planning MapServer via the Shared Location Information Platform (SLIP).
- DBCA Reserves — Department of Biodiversity, Conservation and Attractions managed reserves feed.
- Developments — DPLH Urban Development Program quarterly snapshot.
Data refreshes quarterly. See the full methodology for how we fetch, tile, and render each layer.
Try it
Open the Explore map, scroll the right-hand panel to the Planning & Zoning section, and start with one of the three presets. For individual suburbs, every profile page now carries the same layer panel on the suburb map — Perth, Cottesloe, Joondalup, wherever you're looking.
And if you're specifically trying to rank suburbs by how much change is coming: we've just published the 10 Perth suburbs with the most new housing in the 0–10 year pipeline, and the 10 greenest Perth suburbs by protected-land percentage — both ranked directly from the new data.
Want to know when we ship something new?
Join the newsletter — no spam, just feature updates.