Rankings refresh automatically from live data
Perth Primary School Rankings 2026: NAPLAN Performance Compared
Choosing a primary school is one of the first big calls a Perth family makes, and the one most likely to shape where they buy or rent. Government, Catholic, and independent schools all advertise themselves as excellent, but the underlying data tells a more useful story.
This page ranks the top public (government) primary schools in Perth by NAPLAN, refreshed automatically as new ACARA data lands. ICSEA and attendance are shown alongside each school as context, so you can see whether high NAPLAN reflects teaching quality or simply an advantaged cohort.
Our ranking methodology
Every public primary school with a published NAPLAN result is included. The headline Score is a NAPLAN percentile:
- The five NAPLAN domains (reading, writing, numeracy, grammar, spelling) are pooled per school, averaged across Year 3 and Year 5
- The pooled average is converted to a percentile within the WA public primary school cohort: 90 means top 10%, 50 is metro median, 0 is bottom
- If NAPLAN is suppressed by ACARA (small enrolments, fewer than 30 students at a year level), the percentile falls back to ICSEA, which correlates strongly at school level
That is the whole formula. ICSEA and attendance are not blended into the score. They are displayed next to every school so you can interpret the NAPLAN result for yourself, not buried inside a weighted average.
Why NAPLAN-only, not a composite
Most rankings on the open web (My School Ranking, league tables in newspaper round-ups) sort by Year 5 NAPLAN alone. That tracks postcode wealth almost as closely as it tracks teaching quality, because students from advantaged communities arrive at school already ahead.
A blended composite (NAPLAN + ICSEA + attendance, weighted) sounds more sophisticated but hides the question instead of answering it. We tried it. The trouble: the weight choices are arbitrary, and the final number flattens the trade-offs you actually want to see. By keeping the score NAPLAN-only and putting ICSEA on every card, you can answer the harder question yourself: which schools are getting the best results given the cohort they enrol? A school in the top 10 here with sub-1000 ICSEA is doing something genuinely impressive. A school near the top with ICSEA 1180 is coasting. The transparency matters more than the apparent precision of a blend.
School performance metrics, what we display
Each school below shows four data points:
- Score: NAPLAN percentile (0-100, higher is better)
- ICSEA: 1000 is national average; higher means more advantaged community
- Attendance: percentage of school days attended, averaged across year levels
- NAPLAN average: mean of all five NAPLAN domains, raw score
We deliberately exclude fees here (most public primaries are free or near-free) and sector (this list is government schools only; Catholic and independent get separate rankings to keep the comparison fair).
How the score scale works
| Score | Tier | What it means |
|---|---|---|
| 90-100 | Top 10% | Top 10% of WA public primary schools by NAPLAN |
| 75-89 | Above average | Well above metro NAPLAN median |
| 50-74 | Median | Around metro NAPLAN median; mainstream public primary |
| 0-49 | Below median | Below median NAPLAN. Read alongside ICSEA before drawing conclusions |
How to read ICSEA
| ICSEA | Community advantage | Example |
|---|---|---|
| 1150+ | Strongly advantaged | Top 10% of Australian schools by socio-educational advantage |
| 1050-1149 | Advantaged | Most affluent Perth suburbs sit here |
| 950-1049 | Average | National average is 1000; most Perth public primaries fall in this band |
| Below 950 | Less advantaged | ICSEA below 900 indicates significant socio-educational disadvantage |
The 2026 rankings
The top 10 below are the highest-NAPLAN public primary schools in the Perth metro area as of the latest ACARA data refresh.
Schools that punch above their weight
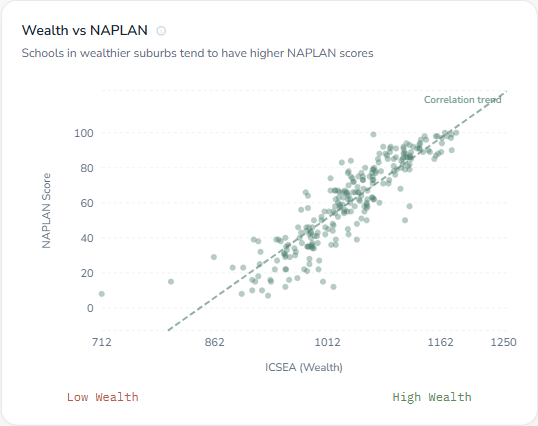
Explore the live ICSEA vs NAPLAN chart on Schools. Hover any dot to see the school name, NAPLAN domains, and suburb.
The headline rankings reward both teaching quality and the postcode advantage that comes with affluent catchments. The more interesting list is the schools that outperform their ICSEA: strong NAPLAN scores in communities where you would not necessarily expect them. Those schools point to genuine teaching quality, not just student composition.
In practice this means scanning the table for two patterns. First, schools where NAPLAN sits 50+ points above what ICSEA would predict, those are the unambiguous teaching-quality wins. Second, schools where attendance is 92%+ in a community where it could easily slip lower, sustained attendance in a less advantaged catchment is one of the strongest correlates of long-term outcomes.
If you are choosing a school, check both the headline ranking and the gap between NAPLAN and ICSEA. A school 10 positions below this list with NAPLAN well above its ICSEA is doing more for its students than one near the top with the inverse.
Why Catholic and independent schools are missing
This list covers WA government primary schools only. Catholic primaries (Catholic Education Western Australia operates around 160 schools across WA, with dozens of primaries in the Perth metro area) and independent primaries have different fee structures, admissions, and intake catchments, mixing them with government schools in the same league table produces a misleading comparison. Catholic and independent rankings will get their own pages so each sector is compared on like-for-like terms.
The price-of-catchment trade-off
Moving into a top-school catchment is a real strategy, and one of the strongest drivers of suburb prices in Perth's middle ring. The catchment premium for the schools on this list typically adds 10-15% to median house prices versus similar suburbs just outside the boundary (commonly cited figure from Perth buyers' advocates for top zones like Rossmoyne, Willetton, Shenton). Whether that trade-off is worth it depends on how long you plan to stay, how confident you are the school's ranking will hold (most do, but not all), and whether out-of-catchment application would work as a cheaper alternative.
How to know if your address is in catchment
Public primary schools in Perth allocate places by local intake area, what most people call the catchment. Your address determines guaranteed enrolment at exactly one primary school. Our WA catchment guide walks through how to find yours and what your options are if you want a different school.
Looking at high school performance instead?
See Perth high school rankings 2026 for the secondary-school equivalent ranking, also a Year 9 NAPLAN percentile with ICSEA shown alongside as context.
Data & methodology
The Score is a NAPLAN percentile calculated by our data pipeline from ACARA-published results. The five NAPLAN domains (reading, writing, numeracy, grammar, spelling) are averaged within each school across Years 3 and 5, then converted to a percentile within the WA public primary school cohort.
ICSEA and attendance are shown alongside each school but do not influence the score. If NAPLAN is suppressed by ACARA (small cohort), the percentile falls back to ICSEA percentile, which correlates strongly at the school level. Flagged in the data when this happens.
Inclusion criteria: Government sector, Primary or Combined school type, and a non-null score. We exclude Catholic and independent sectors here, they have different fee structures and admissions and warrant a separate ranking.
Data sources: ACARA / MySchool for NAPLAN, ICSEA, attendance, and enrolments. Suburb-level context (median prices, crime, demographics) comes from real estate websites, WA Police, and the ABS Census 2021. Refreshed automatically from our data pipeline when new ACARA releases land, typically annually in March.
Nick Lilleyman
Founder & Data Lead, Burb Score
Nick built Burb Score to give Perth families a data-driven view of where to live. He works directly with the ACARA, WA Police, ABS Census, WA Rental Bonds and real estate datasets that power every ranking on this site. Rankings are generated programmatically from official data sources, not opinions, and refresh automatically. No sponsored content or paid placements.
Frequently asked questions
What does the score measure?
It's a NAPLAN percentile (0-100). The five NAPLAN domains (reading, writing, numeracy, grammar, spelling) are averaged within the school across Years 3 and 5, then ranked within the WA public primary cohort. 90 means the school sits in the top 10% by NAPLAN. ICSEA and attendance are shown alongside but do not feed into the score.
Why is ICSEA not part of the score?
Blending ICSEA into the score hides the question we want you to answer. A school with NAPLAN 95 and ICSEA 1180 is coasting on a privileged cohort. A school with NAPLAN 90 and ICSEA 980 is doing far more for its students. The honest version: NAPLAN is the score, ICSEA is the context you read alongside it. Both numbers visible on every card.
Why aren't Catholic and independent schools listed?
This page covers WA government primary schools only. Catholic and independent sectors will get their own rankings, fee structures, admissions, and intake areas differ enough that mixing them produces a misleading league table.
How often do these rankings change?
Rankings refresh automatically when new ACARA data lands in our pipeline (typically annually in March). Individual school scores move when NAPLAN shifts year-over-year.
Does living in a top school's catchment guarantee enrolment?
For WA public primary schools, yes, if you live inside the school's local intake area, your child has a guaranteed place. Out-of-catchment applications are subject to space and a priority list. See our catchment guide for the full enrolment rules.
What does NAPLAN actually test?
NAPLAN (the National Assessment Program, Literacy and Numeracy) tests reading, writing, spelling, grammar, and numeracy at Years 3, 5, 7, and 9. Primary school rankings here pool all five domains, averaged across Year 3 and Year 5, then converted to a percentile within the WA government primary cohort. It is one snapshot, not a complete picture of school quality, which is why ICSEA and attendance are displayed alongside as context rather than blended into the score.
How do I find out which primary school my address is zoned to?
Use our interactive WA catchment map, type your address to see which government primary school you're guaranteed a place at. Or read our WA catchment guide for the full process including out-of-catchment options.
Should I move to be in a top school's catchment?
It's a real strategy and a major driver of suburb prices in Perth, but check the trade-offs. Moving into a top-school catchment usually means higher rent or purchase prices. Our suburb profiles show median prices alongside school scores so you can weigh the cost.
Explore these suburbs further